Lots of info and posts out there concerning the coming El Nino. This is a long post, but I hope you are able to take the time to read it and that you find it interesting. In this all encompassing post, I will cover what an El Nino is, my thoughts on how I think it will affect our weather, and a detailed look at what took place in other winters that had strong El Nino conditions. Typically, viewing the weather posts in the email does the trick, but I have a lot of images, and so I recommend viewing this post on the website. Remember, you can always click an image to get a closer view. https://bryanweatheralert.com/
Table of Contents
- What is El Nino?
- The premise of my forecast
- Temperature anomalies during strong El Nino winters
- Precipitation anomalies during strong El Nino winters
- Month by month details
- Summary of predictions
- The forecast
What is El Nino?
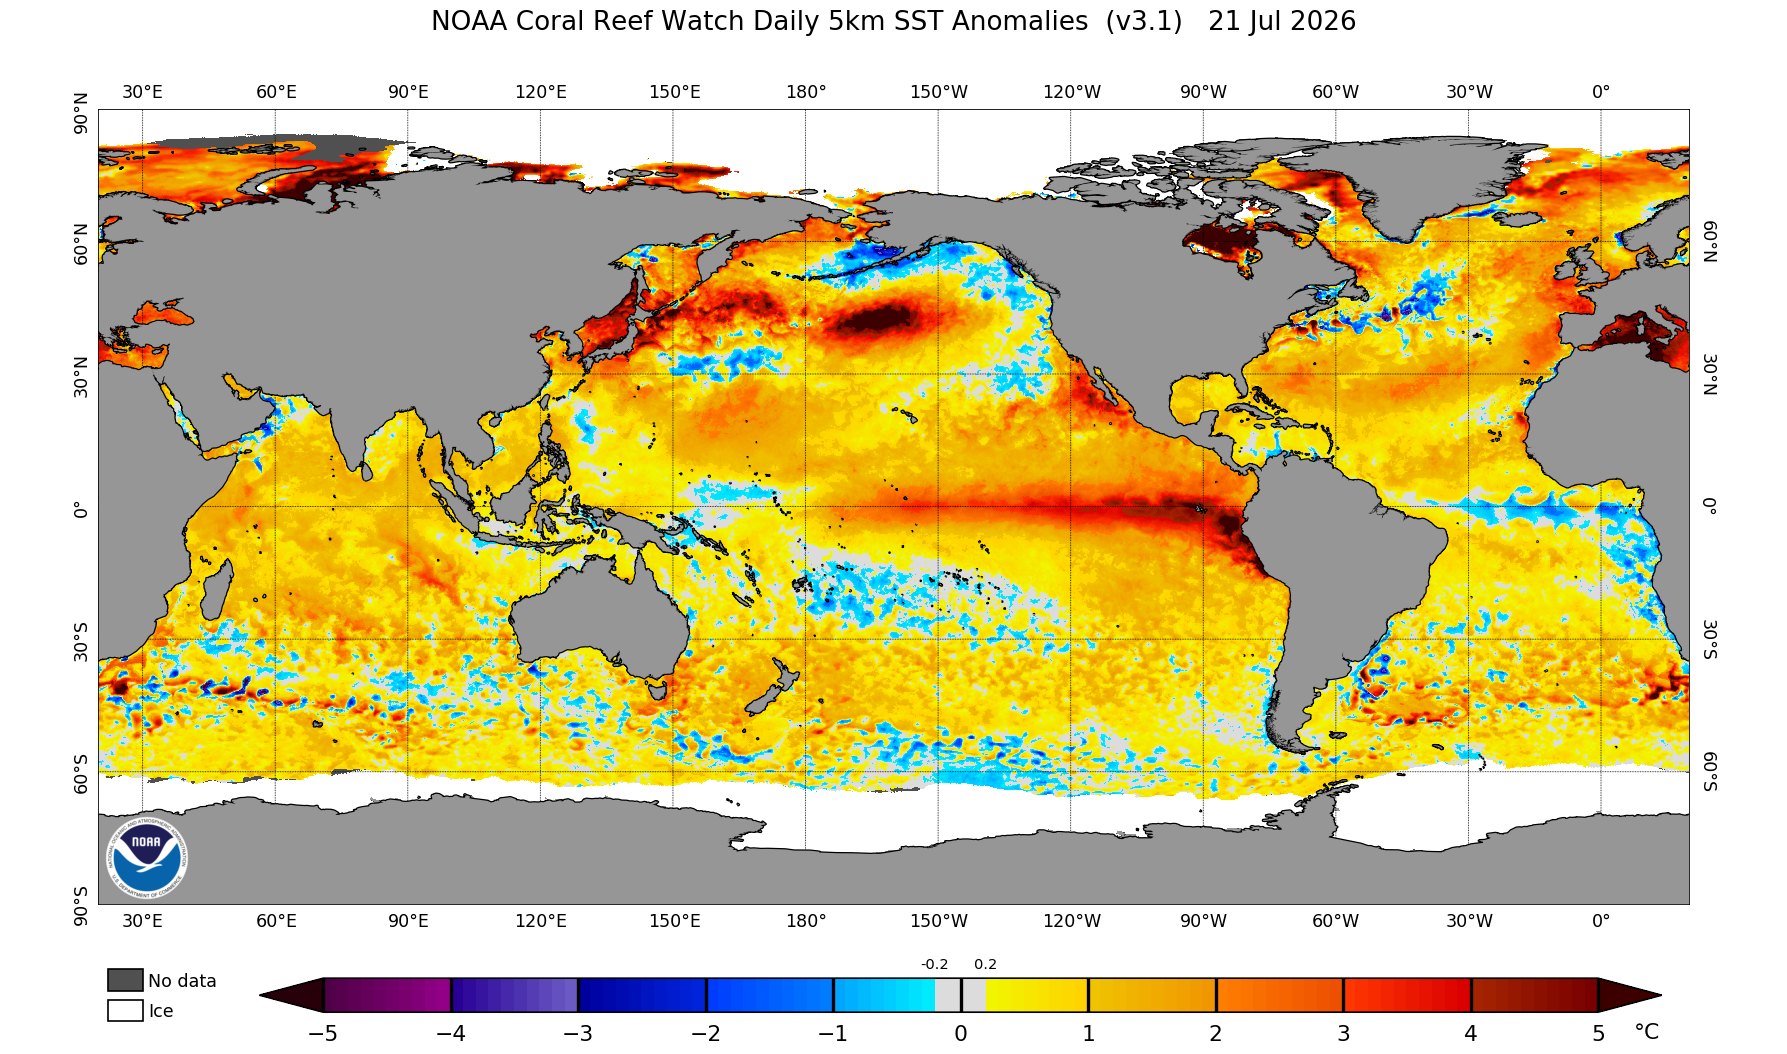
El Nino and its counterpart La Nina are measured in a region of ocean off the coast of South America. Basically, El Niño is a natural phenomenon characterized by the warming of sea surface temperatures in the central and eastern tropical Pacific Ocean. The name means “the little boy” or “the Christ Child” in Spanish, as it was historically named by fishermen off the coast of Peru who first noticed this around Christmas when the birth of Jesus is traditionally celebrated. You can learn more here: ONI ENSO
Look at the very warm ocean waters off the coast of South America stretching out along the Equator. That right there is El Nino, and yes, despite being so far away, it actually plays a very important role in our weather here.
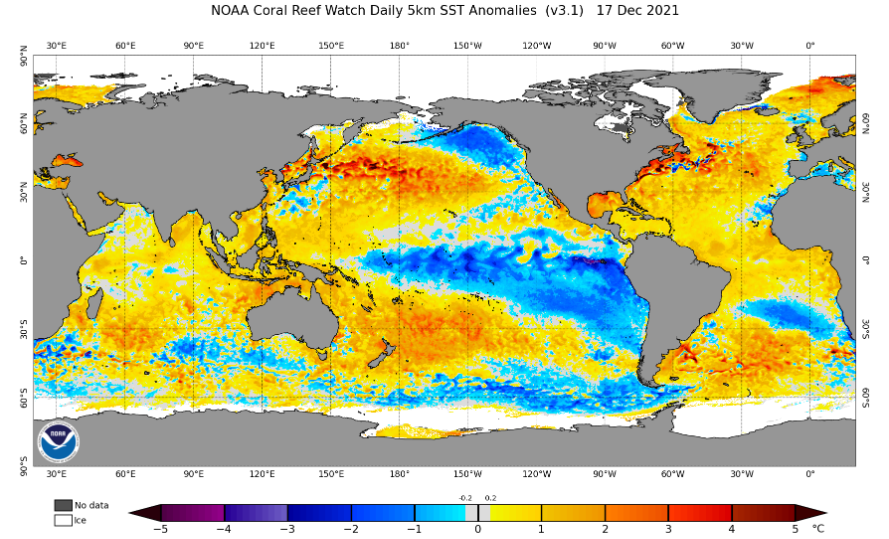
Now compare that to the ocean temperature anomalies during a La Nina. That same region off South America is dominated by cooler than normal waters indicated by the blues.
The premise of my forecast
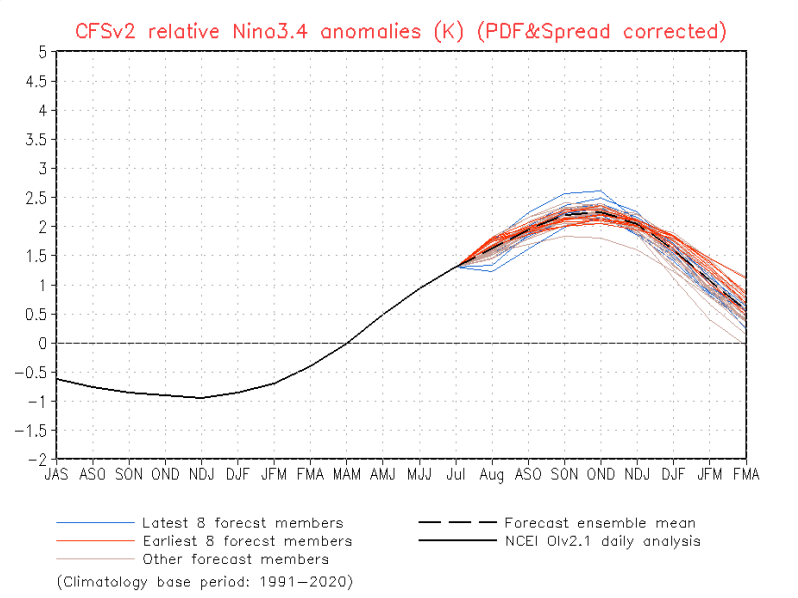
I looked at the Oceanic Niño Index (ONI) and historical El Niño episodes from 1950 to present. Any and all El Nino winters that had at least one three month rolling period with an ONI value of 2° C or higher were included in the analog data set. This is a very consistent way to come up with analog years as I did not exclude or include years to fit a narrative I had in my mind. It strictly came down to the strength of the El Nino. On the image below you can see that this year’s El Nino is predicted to reach above 2° C and possibly up to around 2.5° C making it top tier and fitting the fixed criteria I set in place for the analogs.
The six winters which met the criteria were 65/66, 72/73, 82/83, 97/98, 2015/2016, and 23/24. I was really impressed with how well all six years lined up in regards to weather patterns and what took place in them. I looked at the precip and temperature anomalies of the individual months of December, January, and February (our core winter months), and I also broke down in more detail what took place each of those six years. Let’s continue!
Temperature anomalies during strong El Nino winters
Starting with the less impressive statistic (for Oregon). Temperature anomalies for these six winters resulted in warmer than normal conditions in the northern United States, and cooler than normal in the south where an active storm track/jet stream kept temperatures down. Interesting enough, those years averaged together resulted in no significant change in temperature up or down (warmer or cooler) for Oregon.
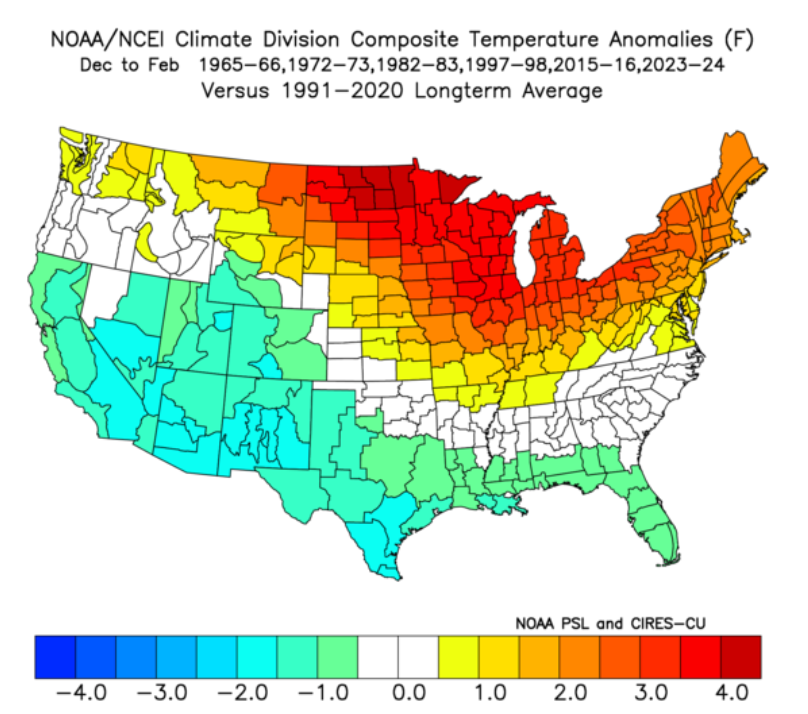
I’m leaning towards slightly warmer than normal for the winter as a whole with warmer conditions dominating the stormier periods. Occasional cold spells (both wet and dry) will sort of balance things out a little, but I still predict we end up a little bit warmer than normal. Such patterns appear to have been common during many of the analog years as well.
Precipitation anomalies during strong El Nino winters
Okay, pay attention to the details for this one haha! In a typical El Nino winter, the warmer than normal waters strengthen the sub tropical jet stream sending more storms into California. This often leave us drier than normal. Below is a map showing precip anomalies during regular El Nino winters for the months of December through February.
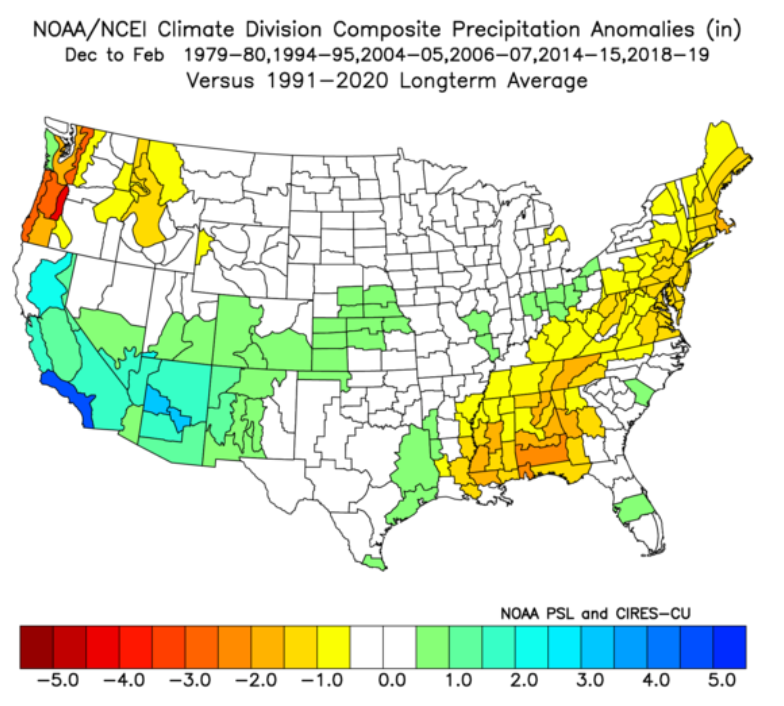
Notice how all of western Oregon is quite a bit drier than normal on the order of 3 to 5 inches during these regular El Nino Winters, BUT this El Nino is predicted to be one of the strongest on record. So what typically happens during the strongest El Nino winters? Well look no further than this next image. 😉 Same parameters (precip anomalies for Dec – Feb) for the top six strongest El Nino winters on record.
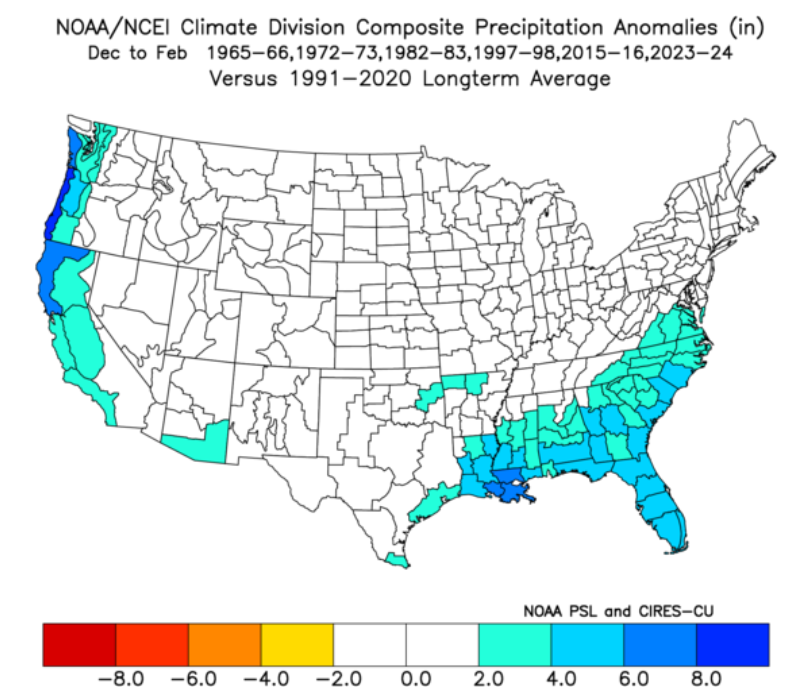
A significant difference with western Oregon being anywhere from 2 to 8 inches wetter than normal. That’s a 5 to 13 inch difference compared to the average precip seen during weaker El Nino winters! Do you see why a generic post of “El Nino winters give us dry conditions” is quite misleading?
What I believe happens is the sub tropical jet becomes even stronger during these really strong years pushing powerful and wet storm systems further northward than in a typical El Nino leading to the wetter than average conditions here in Oregon.
I hope you find this post helpful. My goal is to provide you with the most accurate information available. There are lots of generic posts like this one below circulating around, and sadly, virtually no thought process goes into making such graphics. These posts lump all El Nino winter effects together with no distinction based on the strength of the El Nino. The premise of my entire post is that strength matters.
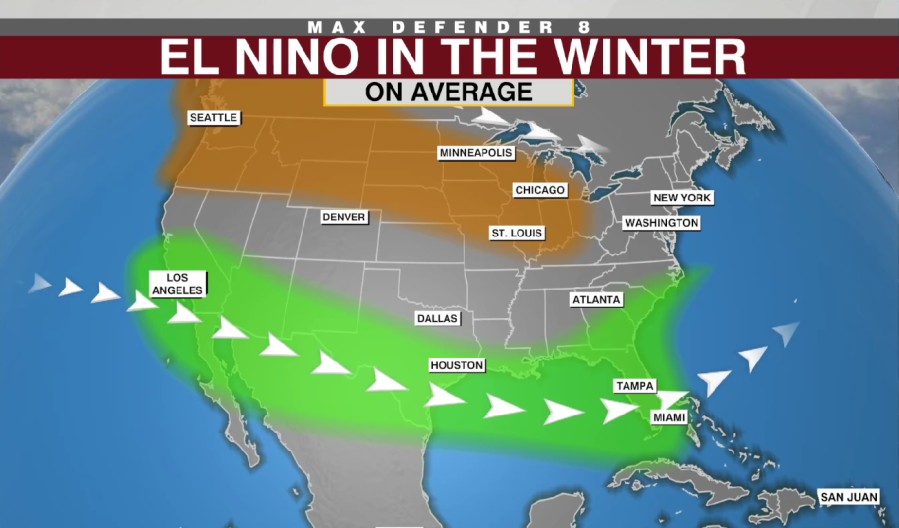
Again, just by looking at the precipitation anomalies alone you can see how the more typical El Nino winters and the top six strongest El Nino winters are not the same animal. If viewing on the website, use the slider tool below to see the differences in a side by side format.
Month by month details
I’ve analyzed the total precip for each individual month from our six analog winters. Typically I’m not big into predicting weather month my month, but the consistency in how these analog years played out gives me reason to try it for this winter.
The darker the green coloring is on the chart below, the wetter that month was. On the flip side, the brighter or more vibrant the yellow, the drier that month was. I’ve also made reference to all snow & ice events from each winter, and the specific month they occurred. Wintry events are labeled in purple.
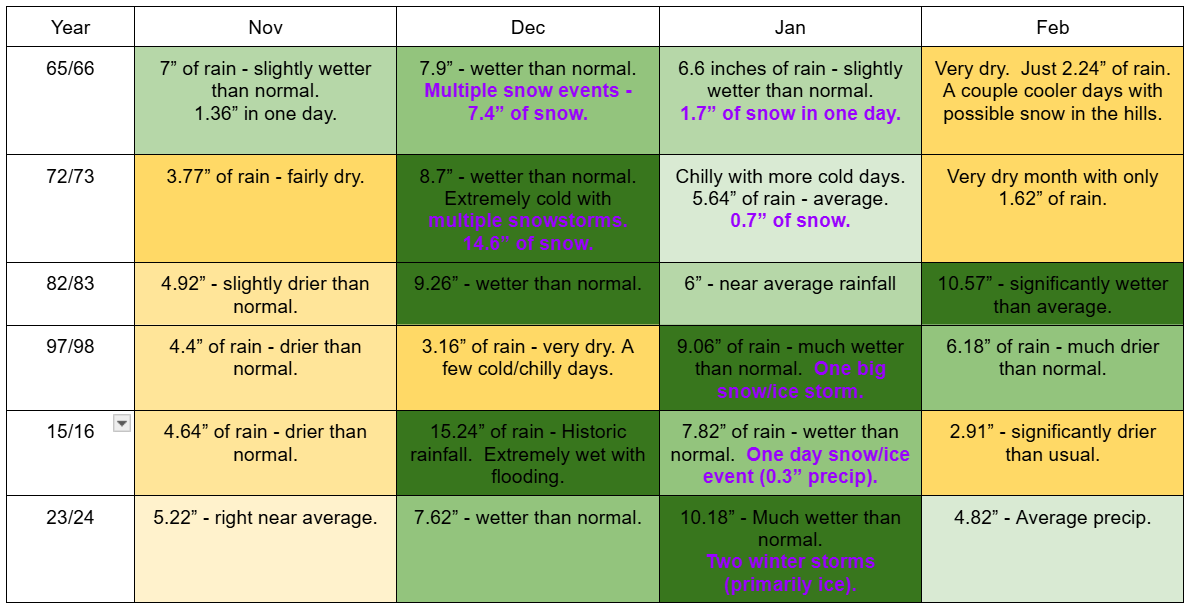
Novembers in these analog years were surprisingly docile. Not extremely dry, but generally on the drier side of average.
It’s the months of December and January which caught my attention. These two months are when the soaking rains really kick in. 5 of 6 analog years had a wetter than normal December and January, and the only year that didn’t have a wet December ended up with a very wet January and February. Point is there’s a good chance these months are going to be wet! I’m leaning heavily towards elevated chances for rainstorms, flooding, and mudslides, especially in the months of Dec & Jan.
What about snow? For about 99% of you, this is what you came here for haha! You root for at least a little bit of snow each winter, and I’m right there with you lol! Five of the six analog years had at least some sort of snow or ice event, and two of the years had multiple events. Seems like good odds of getting something wintry.
And finally, let’s look at the much more immediate future. Check out the rainfall totals for the month of August during a strong El Nino. Seems to me like there is a correlation between strong El Nino conditions and wetter weather in August.
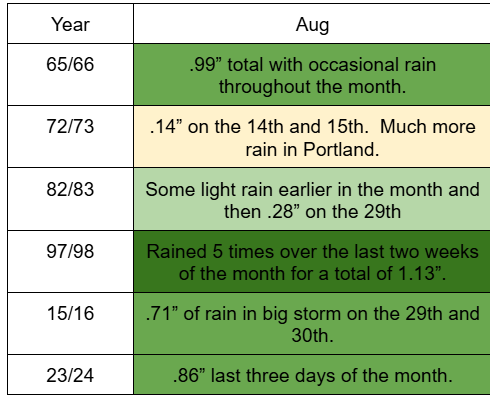
Since 1980 we have had 7 totally dry Augusts with 2018 being the last time that took place. I would be shocked if this year was one of those completely dry years, and I’m betting that we not only see a little rain, but that we get some sort of late summer soaking. Again, this comes from the analog years which have fairly remarkable similarities.
Summary of predictions
Wet weather in August
I expect to see more wet weather this August than in a typical August. All six analogs had more than a tenth of an inch of rainfall and some were downright soakers! This would greatly limit wildfire potential west of the Cascades if this ends up coming to fruition. Don’t confuse wet with cool though. A few rainy days does not mean the rest of the month wont’ be warm or even downright hot at times. I just find it very unlikely we experience a totally dry Augusts like we occasionally see around here. And no, the drizzle we may see tomorrow (Saturday August 1st) would not qualify as significant wet weather. I’m talking at least a quarter of an inch or more. Let’s see what the middle and end of the month bring…
A regular fall season
Despite the wetter weather I’m predicting for August, the majority of the Octobers and Novembers in the six analog years were on the drier side of average. I think a late summer rain storm can give the impression that the coming fall is going to be overly wet, but the data available to us does not back such claims up. I’m hedging my bets that after some late summer rains, we see a fairly typical fall with plenty of dry stretches alternating with periods of stormier/rainier weather.
A wet December and January
This one seems pretty certain. I mean look at the months of December and January on the chart again, and there’s a clear signal that these two months will probably end up on the wetter side of things. The only dry December on there took place in 1997, but we made up for it with 9 inches of rain in January and over 6 inches in February, so a wet winter appears likely for the Salem area.
Expect at least one opportunity for snow or ice
5 of 6 analog years had at least some sort of snow or ice storm. The maybe frustrating part for us living in/around Salem is how a few of those years primarily saw freezing rain or ice versus the soft, fluffy snow we hope and dream of seeing. Bottom line is, I think we will get at least one brush with wintry weather this year (maybe more), but whether it’s in the form of snow or ice cannot be determined from the analog years alone. Time will tell for that detail. I at least like our odds of seeing something frozen.
Mountain snow
Less research went into this, but it appears the warmer nature of the storm systems during a strong El Nino favor more snow at the higher elevation ski resorts, and a little less at the lower down ones. What I can tell you is that even for the lower elevation ski resorts, these strong El Nino winters were typically not listed among the worst years on record and some of the years ended up being pretty decent for the ski industry. There weren’t top tier or close to it, but they got the job done so to speak.
Even for Timberline, where the base snow depth is measured at the top of the Pucci Chair (5900+ feet above sea level), there were zero analog years in the heaviest snowfall data set, and zero years in the lightest snowfall data set. This lends more weight towards the idea that this coming winter might be just sort of average for the mountains, and after last winter’s dismal conditions, I think average sounds just fine to me.
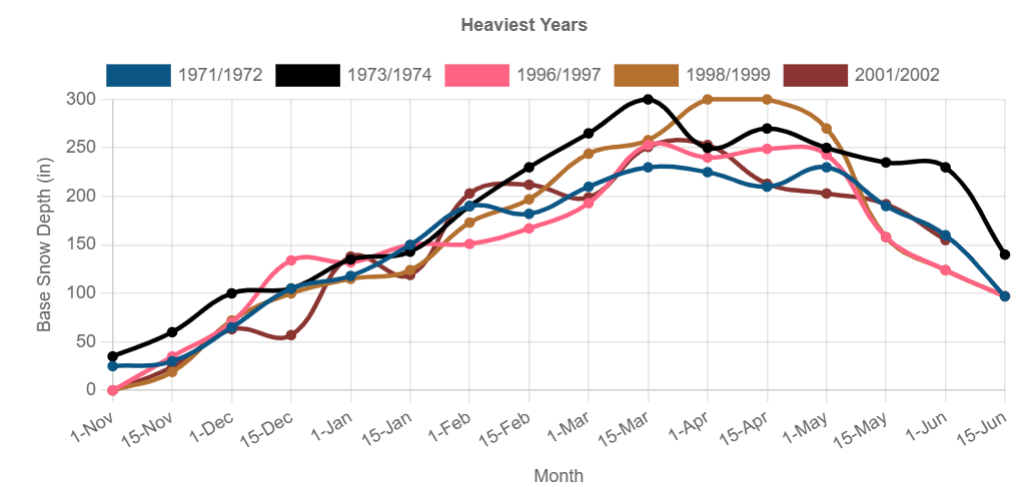
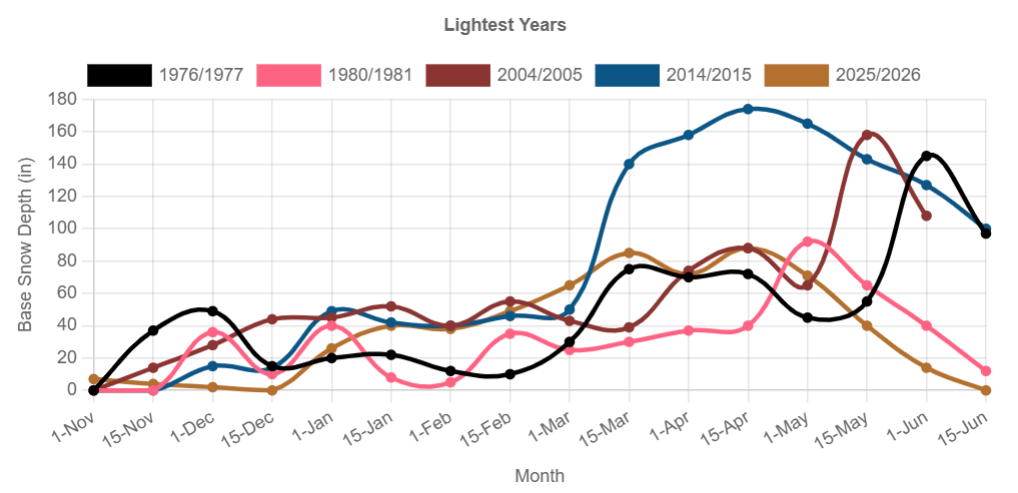
By the way, three of the five lightest snowfall totals for Timberline occurred during a weak El Nino winter, but no strong El Nino winters are present in this data set. Are you getting the idea that strength matters? 🙂 I think the mountains will fare at least decently well in the snowpack department this winter.
The forecast
Okay, happy last day of July and happy August. Looks like we warm back up after the cooldown this weekend. Highs Saturday will be in the mid 70s with a slight chance of a sprinkle. Highs in the upper 70s on Sunday, mid 80s Monday, lower 90s Tue & Wed, and then back into the mid to upper 80s for the remainder of next week. Very typical summer weather. No more thunderstorm chances for the foreseeable future and no long lasting heatwaves either.


Pingback: Hot and smoky – Bryan Weather Alerts