
Welcome to October!! This is an exciting time of year for weather here, and I have a full post loaded with stats, maps, charts, graphs, and fun facts. Take a look at the headlines in case you’re short on time.
Headlines
- Detailed look at temperatures in September.
- Detailed look at precipitation from September and from the past year.
- Detailed look at what to expect in October.
- A quick forecast for the next several days is located at the very bottom.
September 2025 in review
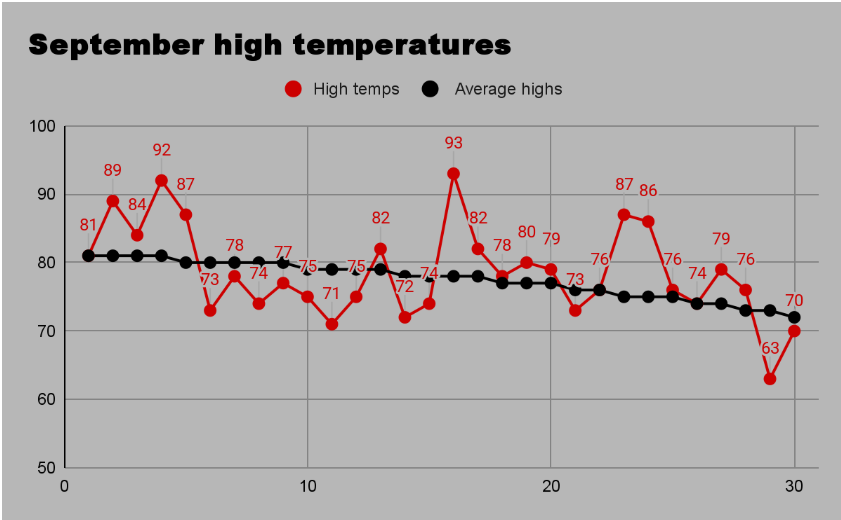
The month started off very warm and humid. The first five days of the month had highs above 80°. We also had a couple of thunderstorms in the area, but nothing widespread. In general, warm/humid conditions dominated the first half of the month. So warm that it took until the 15th before we finally experienced a temperature cooler than the lowest temperature from August! The rest of the month went on without anything real notable. Our coldest temperature took place the morning of the 26th with a chilly low of 43°, and the hottest temperature of the month occurred on the 16th with a high of 93°.
This first graph shows Salem’s daily high temperatures compared to our average high temperatures.
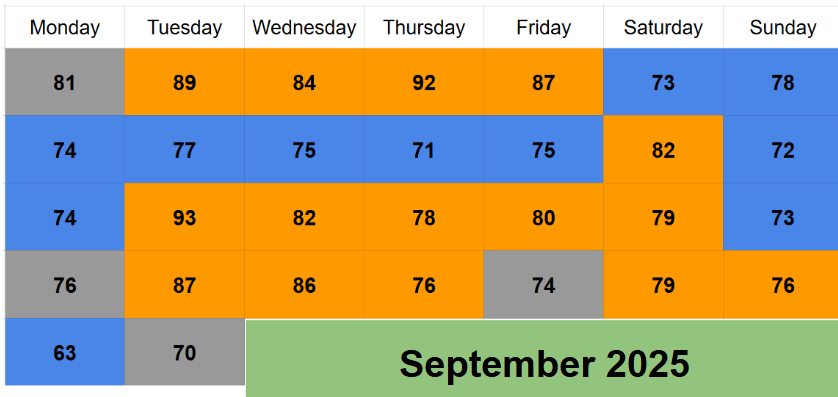
This next chart is the same exact information, but displayed like a calendar of September (well minus the dates lol). Days highlighted grey indicate highs right at average for that day, orange highlighting indicates warmer than average high temperatures, and then we have blue representing colder than average highs. It’s a fun alternative way to display the same information.
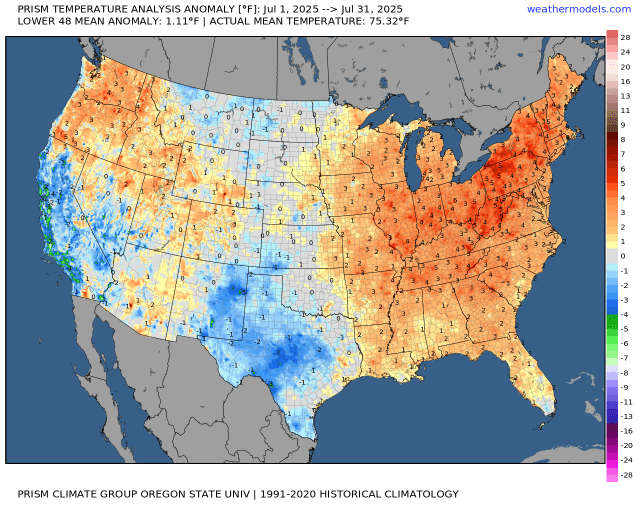
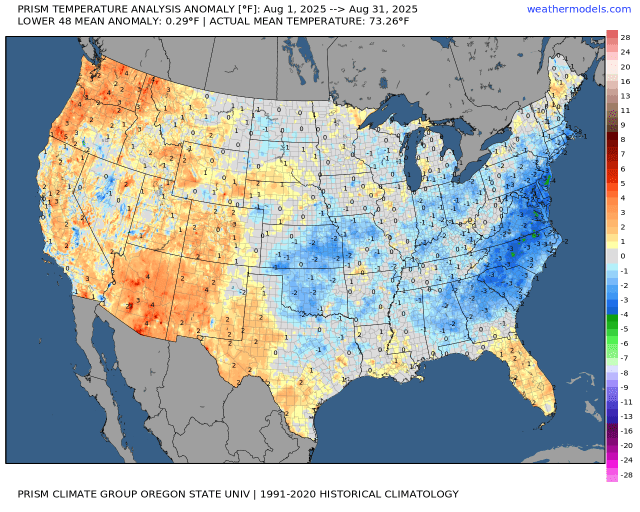
More warm days than cool days, and when combined with our warm overnight lows, September 2025 ended 2.1° above normal. Thumb through these next images to see temperature anomalies from June, July, and August for the lower 48. These provide an easy way to see how summer played out across the nation. Note that September maps are not available at this time.

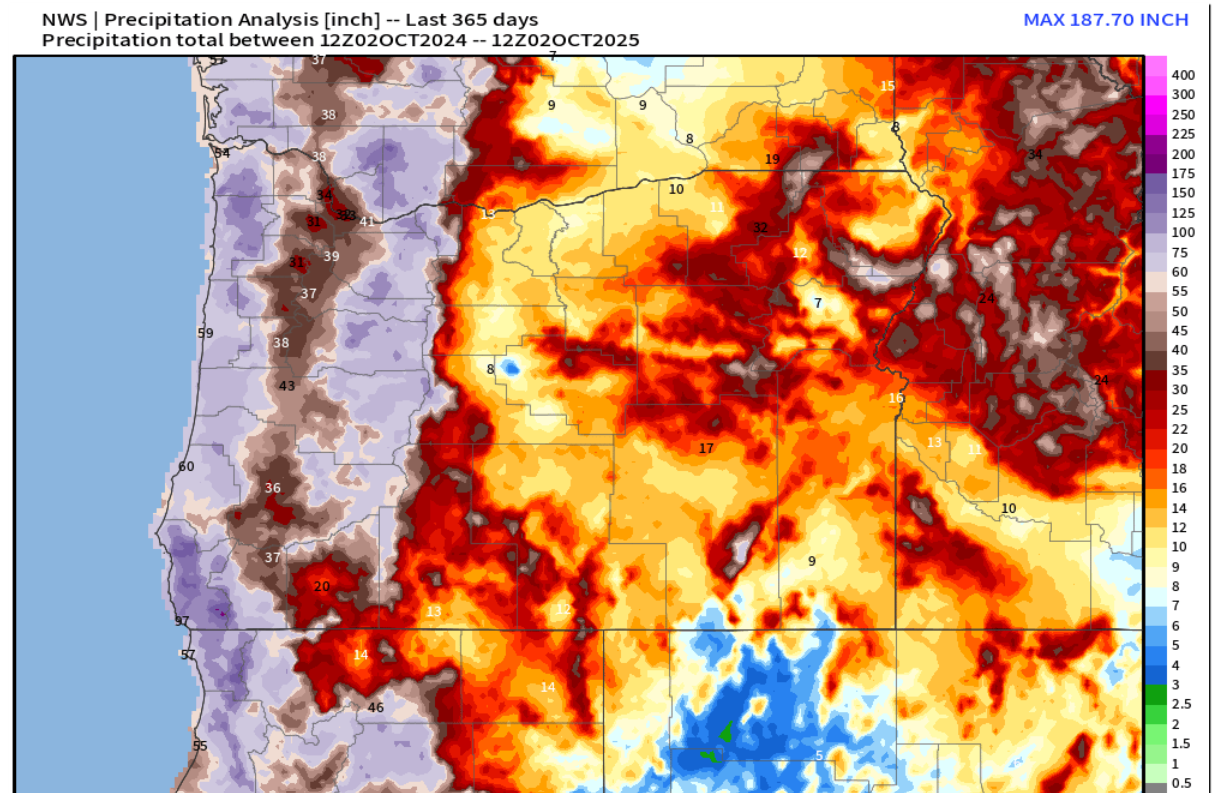
Moving onto precipitation, the winter of 2024/2025 was on the slightly drier side of things for the Pacific Northwest as a whole. This map shows how much precipitation we have received over the past year. You can see the slight “rain shadow” effect of the Coast Range and a much more significant effect from the Cascades. The wettest location is a little spot located in the southern Oregon Coast Range where 187″ of precip were recorded over the past year!!
Despite all the rain, we are currently in a little bit of drought.
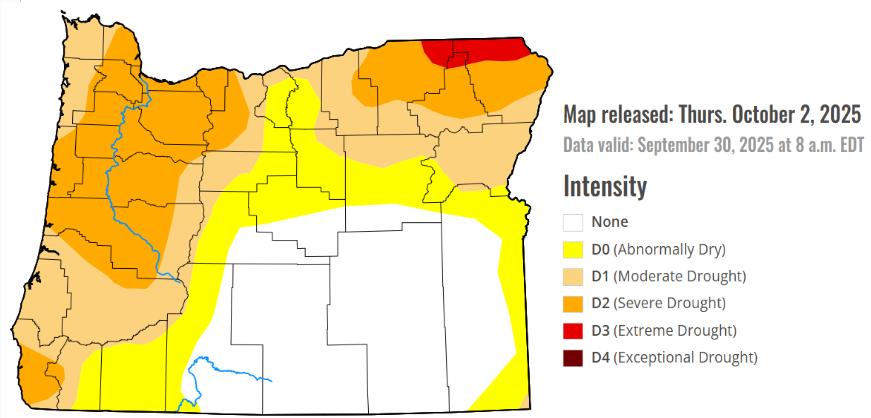
You can have buckets full of rain, but if you live in a location where tons of rain is normal, then it is still possible to experience drought conditions. It all depends on when the rain falls (too much at once versus spread out over time), and of course how much rain has fallen in total. This year, we had an unusually dry April, May, and June which put us behind as we headed into our dry summer.
Notice how well a large chunk of central and eastern Oregon are doing in regards to precipitation. That’s thanks to the numerous thunderstorms they saw during August and early September.
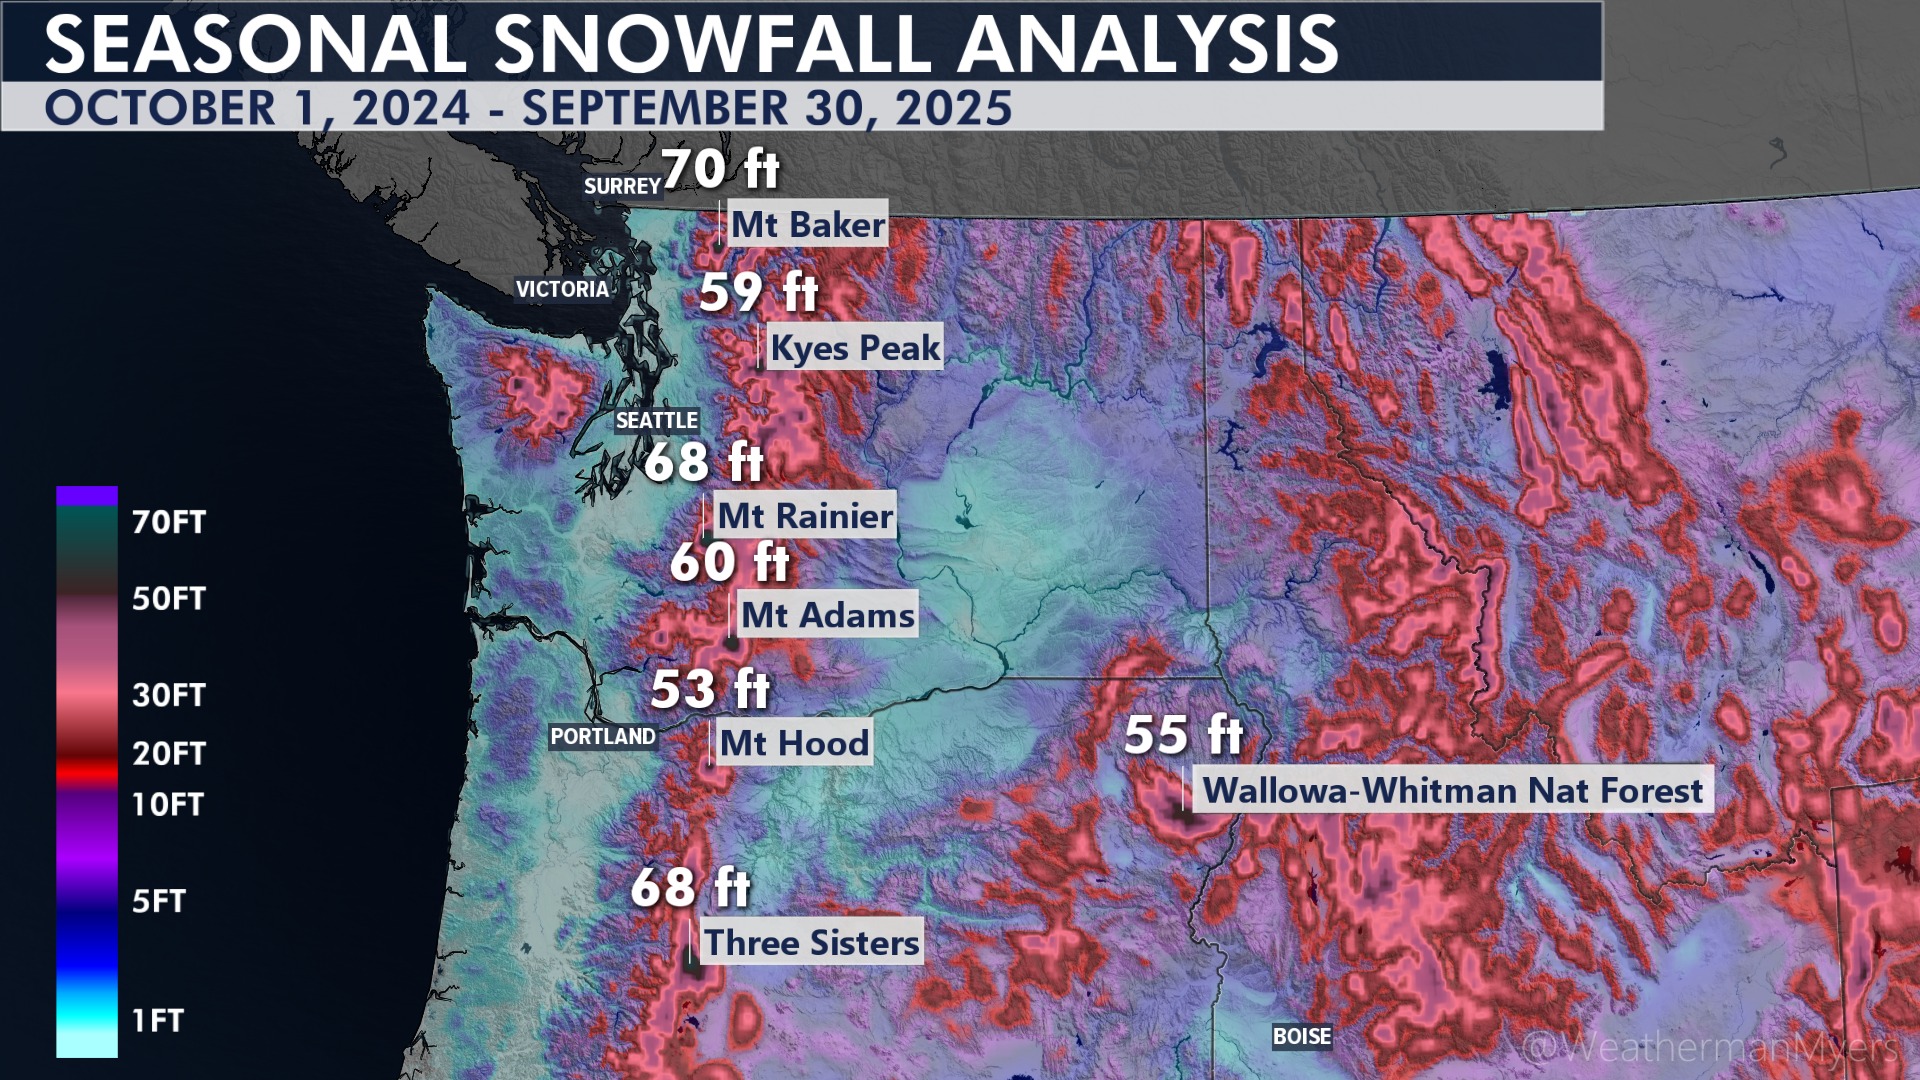
Regardless of the slightly drier weather, it’s amazing to see the sheer volume of snow that still piled up in our mountains since last year. Check this out!
The seasons are changing, it was foggy this morning, we had measurable rainfall four days this week which was our longest wet streak since May, and I believe our drought conditions will soon be behind us! Time to move onto October to see what lies in store…
October
October is a new beginning for Salem and the pacific northwest. October 1st is officially the beginning of our rainfall (water) year, our average high plunge from 72° on the 1st down to 58° by the end of the month, record lows start dipping into the 30s and then the 20s, and precipitation doubles from what we normally see in September. Put all together, and no other month features such a drastic change in our local weather as October does.
A very good question people ask this time of year is why our rainfall records begin on October 1st and not January 1st. The reason is because the vast majority of our rainfall takes place October through March, and if we stuck with the traditional date of January 1st for record keeping then we would be cutting our rainy season in half. Having it begin in October simply makes sense for record keeping, historical analysis, water management, forecasting for water availability, drought outlooks etc.
What is ahead?
Well, I’m still going with a few scattered showers this Saturday. Much of the day should remain dry, but it would be wise to plan on at least one or two brief showers moving through at some point during the day.
Sun – Tue: Totally dry. Highs gradually rise from 71° Sunday up to 77° come Tuesday. Lows each morning will begin in the low to mid 40s. Lots of sunshine during these three days!
Wed: Lower than usual confidence at the moment for both Wed and Thu. For now expect clouds to increase with a slight chance of rain late in the day on Wednesday. High of 68°.
Thu: Showers possible. Highs 62 – 65°.
There you have it! Get outside this weekend or early next week if possible, and enjoy the beautiful weather!!
