
October 2020 is done. Just two months to go before 2020 is also in the bag… The highlights for the month would probably be the consistently dry weather we saw (24 dry days this month), and to a lesser extent, the couple of storms we had early in the month which brought wind gusts of 35 to 40mph.
This graph shows Salem’s actual high and low temps per day along with the average high and low temps for October.
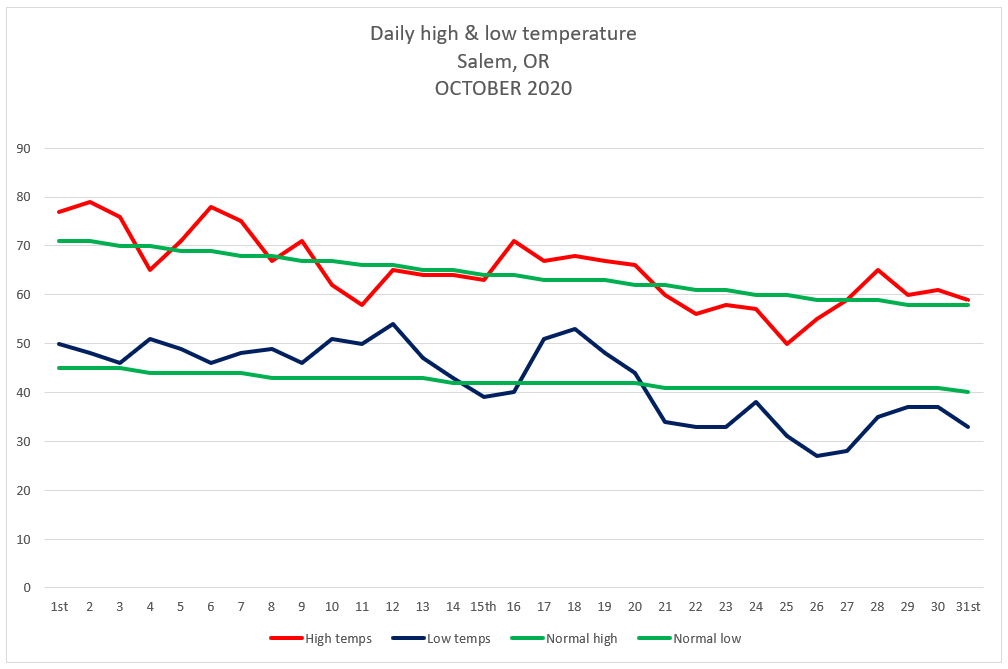
Temperature
Warmest high temp was 79° October 2nd
Coldest high temp was 50° October 25th
Warmest low temp was 54° October 12th
Coldest low temp was 27° October 26th
3 days with lows at or below freezing.
Precipitation
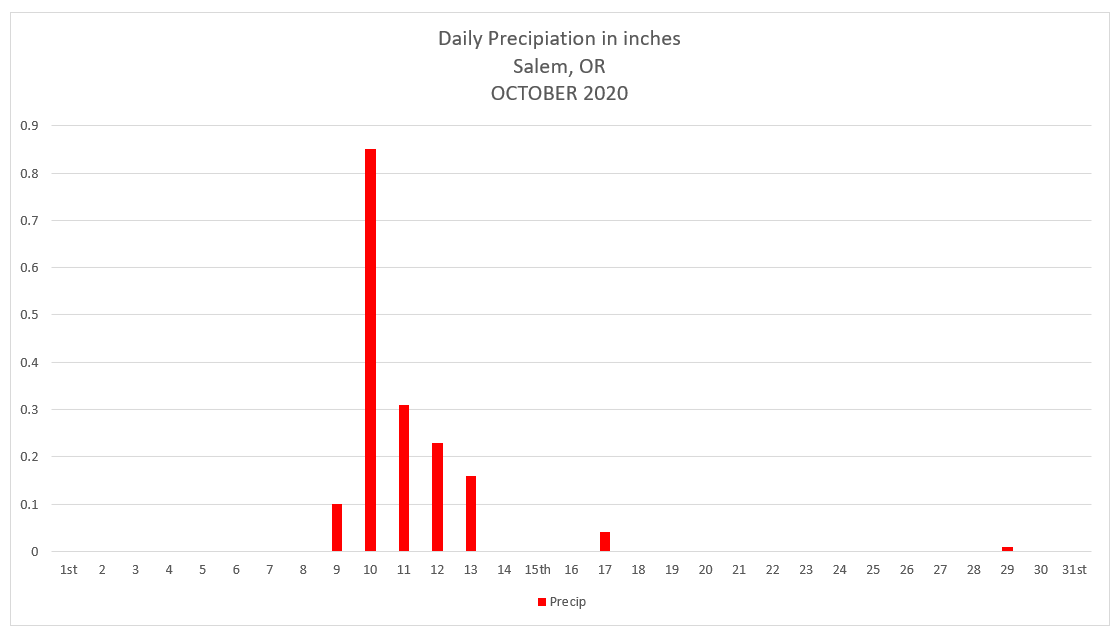
Salem saw rainfall on 7 days during October with .85” of rain falling on the 10th making that the wettest day for the month.
October 2020 Summary
Despite having a number of warmer than normal days with lots of mild afternoons, October ended at only 0.77° above average thanks to the cooler weather, and more specifically the cold mornings we experienced the last several days of the month. As far as precipitation goes, October 2020 saw only 56% of our normal precip making for a much drier than normal month.
Looking ahead
November is our first real month of our winter/storm season. It’s the second wettest month of the year beat out only by December. As far as valley snow goes, November snow is quite rare. In fact, 2010 was the last time Salem recorded sticking snow in November, and the time before that was in 2006, so perhaps one could say we are due for a little this year. 😉
Even more overdue and more likely than November snow is a wet November. The last really wet November occurred back in 2012. Every November since then has been either right around average or drier than normal. Last November was one of the driest on record with less than one inch of rain for the entire month! I have a feeling this month will be a bit more active….

