The incredibly popular “Bryan Weather Alerts” are now featured on this stunning website. Below is a guide to all the pages found on this website and the content/purpose of each page.
Home Page
Contains my latest posts, a link to the Instagram Page, and some forecast updates & highlights you need to know.
The Salem Area Forecast
Contains a nice overview of the day and week’s weather conditions, and sometimes a peak further into the future.
The Mountains and Beyond
Here is where you will find all the weather info you need to know for your Cascade adventures and travels.
WEATHER ALERTS
This page contains the very latest updates to the forecast, especially during big storms and or rapidly changing weather conditions. In other words, this page is the true “Bryan Weather Alert” page. 😉
Extra!!
Blog posts which take you beyond the forecast are found here. These posts usually consist of extra details after a big weather event, graphs, charts, pictures, storm recaps, and other special reports. Basically lots of “fun” info to be found here! Posts are organized by our winter/wet season which begin on October 1st each year. We are currently in the 2020/2021 wet season.
Archives
Monthly reports are found under this tab and are divided up by calendar year making it easy to review old reports whenever you feel like taking a trip down memory lane.
Monthly reports
From time to time I do an “end of month” report for Salem with a few highlights from the previous month along with statistics on how far above or below average we were, how much rain and snow we got, and occasionally some additional fun facts related to the month.
Contact
Contact the one and only Bryan Bowles by dropping a comment on any of my recent postings. Also be sure to sign up for emails anytime I post a new forecast. Just find the little “Follow” button in the bottom right corner and add your email.
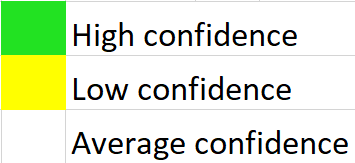
My Forecast Confidence Scale
On the extended forecast graphics you will notice either green, yellow, or no highlighting at all over each day. This highlighting is one way of communicating confidence for that particular forecast. This little chart explains what the colors mean, and is a nice visual tool for letting my wonderful viewers know when a forecast is more likely to change a lot or stay the about the same.