Hehe, I gotta say I thought coming up with that title was pretty darn clever of me. Anyway, all this extra time at home has allowed me to put together some fun weather graphics regarding snowfall here in Salem. It’s a long read, but if you are like me you probably have some extra time on your hands now. If you’re in a hurry the forecast is at the bottom of the post. ENJOY!!!
Below are a couple of charts showing the total snowfall per winter here in Salem. The type of winter each year was (meaning El Nino, La Nina, or Neutral) is also represented, and the winters are abbreviated, so for example this past winter is represented as “19/20.” Yeah, I’m a teacher so I tend to explain things whether people need it or not. Anyway, take a look at these charts and see what you think.
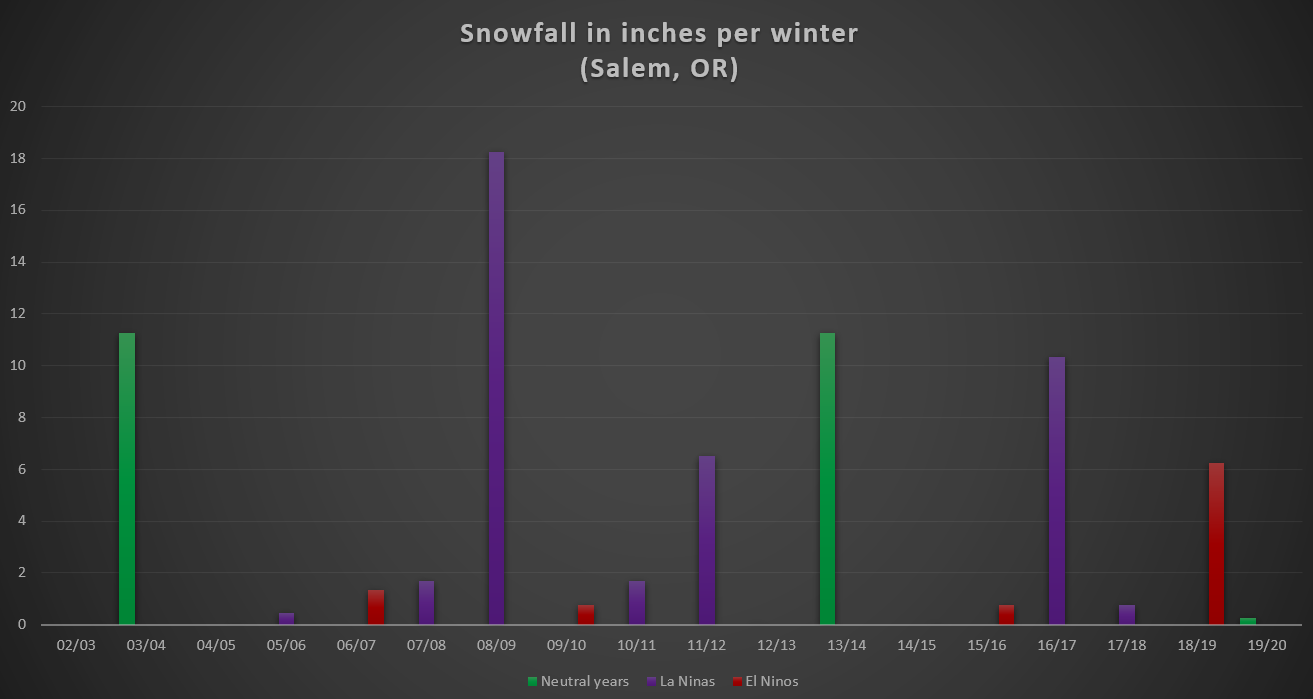
Something to keep in mind is that Salem quit keeping official snowfall totals after 1995 at the airport where “official” records are kept, so finding accurate snowfall totals for the years since than is not an easy task at all. Of course you can make whatever conclusions you would like to make about these graphs, but I want to mention a few things that stood out to me.
1.) In the 36 winters I have sampled here, La Nina winters were 10 for 10 with producing snowfall for Salem. The winters of 05/06 and 17/18 were both very low with grand totals not even making the one inch mark, but even if we count those as “no snow” years it still means 80% of our La Nina years turned out to be “snowy” winters. So, yes, La Nina winters really do have increased odds of bringing valley snow. Speaking of, I hear next winter might be a La Nina. Just saying…. 😉
2.) El Nino winters produce the vast majority of our no snow years. 6 of the 14 El Nino winters graphed on here gave Salem a big fat ZERO in the snow category. Every so often there are exceptions, and last winter, an El Nino, was one of those exceptions with just over 6 inches of snow falling during that cold February. With that said, when El Nino roles around the odds of seeing no snow increase a bit at least here in Salem.
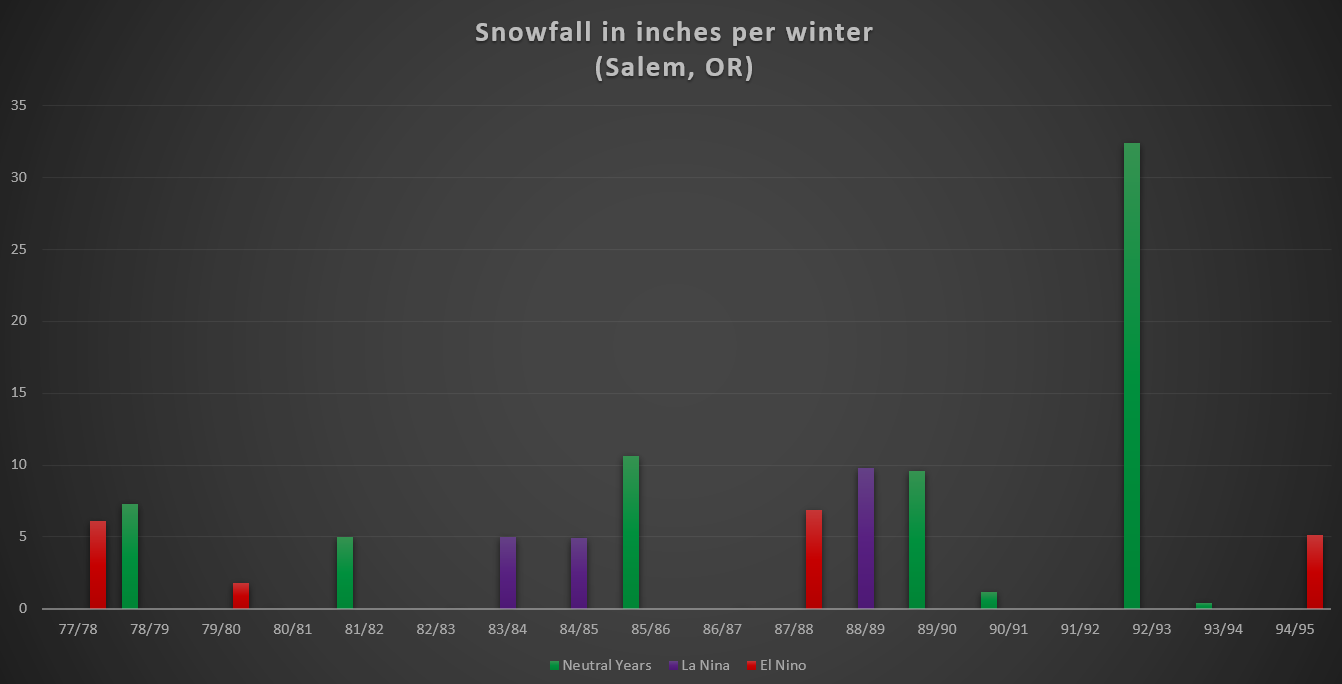
3.) Snowfall has decreased overtime. I know 36 years is a small sample size when you consider the age of the earth, but the change between the two time frames is fairly considerable and worth noting. The average winter snowfall for the 18 years between 1977 to 1995 was 5.89″. The average winter snowfall for the past 18 years is 3.97.” So an almost 2 inch drop between the two time periods. Now, when looking at larger and more complete data sets including data for Portland there are decent indications that we have leveled off a bit and are no longer “dropping.” Not sure if that will continue to be the case, but since I along with all the other forecasters on this planet struggle to get forecasts right a few days in advance, I’m not going to try and predict what our average snowfall will look like three or four decades out much less a few years from now. Just some interesting facts I thought I would share.
4.) The final thing I noticed is how it appears as though we have become more boom or bust in regards to our snowfall overtime. Looking at the past 18 years we had 12 winters with less than 2 inches of snow, but 4 winters with over 10 inches. In the 18 years from 1977 to 1995 we had only 6 winters with less than 2 inches of snow, but only 2 winters with totals over 10 inches. Again, I know this sample size is small; however, it looks as though our climate has become more extreme in terms of snowfall with more years being “all or nothing” lately. When looking specifically at the second chart you can see winters receiving 4 to 10 inches of snowfall were much more common than they are now. Looking at the past 18 years both the number of winters with 2 or less inches of snow AND the number of winters with 10 inches or more have doubled when compared to the previous time frame. Definitely a boom or bust pattern at least in my mind. Interesting don’t you think???? Curious what you guys have to think about all this.
Switching gears a little and taking a closer look at snowfall for the past decade I broke down the snowfall totals by month which reveals more “interesting” statistics. Take a look:

Over this past decade we saw the biggest March snowstorm in 60 years back in 2012. You remember that one right? Several inches fell right before spring break. That month actually had a couple of smaller snowfalls earlier in the month in addition to the big storm which all together added up to a total of 5.25″. We also had some big February snowfalls specifically in 2014 and more recently last year with all those small snow events adding up to a little over 6 inches for the month. Those two years together really made February the big winner this past decade in terms of total snowfall by month, and while February was this past decade’s snowiest month, January and December are still on average the snowiest months of the year; although if this next decade looks anything like this past one than I believe those titles may be in jeopardy. Here is how the numbers break down for the decade:
Feb: 19.25″
Jan: 6.9″
Mar: 6.05″
Dec: 5.25″
Nov: 0.35″
You can see how January barely beat out March for total snowfall, and to be honest it looks like December has some work to do as well if it wants to maintain its status as one of our snowiest months of the winter. I know it doesn’t work this way, but I suppose one could say we are “due” for a snowy December and January as we head into this new decade, and maybe even a snowy November. November 1985 was the last time Salem saw several inches of snow in November, and November 2010 was the last time Salem recorded any snowfall during that month. Rare for sure, but it does happen….
Forecast
While I’m at it I might as well give a quick forecast for the next several days, but first I think we can all agree that we have been blessed with some very nice mid March weather lately. It could easily be 50 something degrees and rainy this time of year. Instead we have had almost a whole week with sunshine and high temps above 60 degrees, not too shabby! Sure makes the little bit of snow we had last weekend seem like a distant memory.
Looking ahead Sunday will still be nice and mild, but with a few more clouds.
Mon: Cloudy, cool and wet at times.
Tue & Wed: Typical shower and sunbreak kind of days. As is normal in this pattern, I expect some of the showers to be quite heavy with brief downpours and small hail mixed in. Overall there should be more sunny times than wet both these days with Wednesday being the sunnier of the two days and thus a bit warmer.
Thu: Dry, but with lots of cloud cover.
Fri: Looks rainy at this time.
Bottom line: Don’t let those weather apps scare you. It may look like a washout of a week, but we should still have plenty of dry and even sunny times between the showers. It won’t be as nice as this week, or even close, but with plenty of dry and sunny breaks between the showers I think it won’t be all that bad. Not a bad time to begin prepping the garden!
Take care and be safe!!

Absolutely fascinating snowfall statistics. Thanks for sharing!
LikeLike